What Your Temperature Can Tell You About Your Cycle
Imagine if your body left behind a tiny clue each morning about what was happening inside your cycle.
It turns out it does.
Your basal body temperature (BBT) is one of the most widely used signs in fertility awareness and cycle tracking. By taking your temperature each morning at the same time, before getting out of bed, you may be able to identify whether ovulation has occurred and gain a deeper understanding of your menstrual cycle.
However, despite what some social media posts might suggest, temperature tracking is not a crystal ball.
Real-life temperature charts are often messy, influenced by sleep, illness, stress, travel, and countless other factors.
The good news? You don’t need a perfect chart to learn something valuable from it.
Let’s explore what basal body temperature is, how it changes throughout the cycle, and what it can — and cannot — tell you.
What Is Basal Body Temperature?
Basal body temperature is your body’s resting temperature.
It is measured:
-
First thing in the morning
-
Before getting out of bed
-
Before drinking, eating, or talking extensively
-
After several hours of uninterrupted sleep
Because your body is completely at rest, small hormonal changes become easier to detect.
The hormone primarily responsible for cycle-related temperature changes is progesterone.
Why Does Temperature Change During the Cycle?
Before ovulation, estrogen is the dominant hormone.
After ovulation, the corpus luteum of the ovary produces progesterone.
One of progesterone’s effects is to slightly increase body temperature.
This increase is small—usually only about:
0.2–0.5°C (0.4–1.0°F)
Yet when temperatures are recorded consistently, the shift often becomes visible on a chart.
This creates the classic biphasic pattern seen in many ovulatory cycles.
What Does a Healthy Temperature Pattern Look Like?
In a typical ovulatory cycle:
Follicular Phase
Before ovulation, temperatures tend to be lower.
Many women record temperatures somewhere between:
36.1–36.5°C (97.0–97.7°F)
However, absolute numbers vary considerably from woman to woman.
What’s more important is the pattern than the exact temperature.
Ovulation
Around ovulation, some women notice:
-
A brief dip
-
No obvious change
-
A gradual rise
Contrary to popular belief, not every woman experiences a dramatic ovulation dip.
In fact, many don’t notice one at all.
Luteal Phase
After ovulation, progesterone causes temperatures to rise.
Many women see temperatures increase by:
0.2–0.5°C
These higher temperatures typically remain elevated until menstruation approaches.
This sustained temperature shift is often the clearest sign that ovulation has occurred.
What Is a Biphasic Temperature Chart?
A biphasic chart has two distinct phases:
Phase 1
Lower temperatures before ovulation.
Phase 2
Higher temperatures after ovulation.
This pattern reflects the shift from estrogen dominance to progesterone dominance.
A biphasic chart is generally considered a reassuring sign that ovulation likely occurred.
Can Temperature Predict Ovulation?
This is one of the most common misunderstandings.
Basal body temperature is best at confirming ovulation after it has happened.
It does not reliably predict ovulation before it occurs.
This is why many fertility awareness methods combine:
-
Cervical mucus observations
-
Cervical position
-
Cycle history
-
Temperature tracking
Together, these signs provide a more complete picture.
How to Measure Basal Body Temperature
Consistency is more important than perfection.
For the most reliable observations:
Use a Basal Thermometer
A basal thermometer measures temperature to two decimal places and can detect very small changes.
Measure Immediately Upon Waking
Take your temperature before:
-
Sitting up
-
Walking around
-
Drinking water
-
Checking your phone
Take It at the Same Time
Try to measure within a similar time window each day.
Record It Daily
Single temperatures mean very little.
Patterns over time are what matter.
What Can Affect Your Temperature?
One reason BBT charts often look less tidy than textbook examples is that many factors influence body temperature.
Poor Sleep
A restless night or frequent waking can affect readings.
Sleeping In
Taking your temperature several hours later than usual may alter results.
Stress
Psychological stress can influence hormone production and body temperature regulation.
Alcohol
Alcohol consumed the evening before can raise temperatures.
Illness
Even a mild cold can affect readings.
Fever will significantly distort the chart.
Travel
Jet lag and time-zone changes often influence temperature patterns.
Room Temperature
Extreme environmental temperatures may affect some people.
Shift Work
Irregular sleep schedules can make temperature tracking more challenging.
Certain Medications
Some medications can influence body temperature or hormonal patterns.
This is why it is important to view temperature tracking as one piece of information rather than a perfect diagnostic tool.
What If My Temperatures Are All Over the Place?
Many women become discouraged when they compare their charts to textbook examples.
In reality, perfectly smooth charts are uncommon.
Normal charts often contain:
-
Random spikes
-
Temporary drops
-
Small fluctuations
-
Inconsistent readings
What matters most is the overall trend.
Try looking for:
-
A sustained rise
-
Two distinct phases
-
Patterns across multiple cycles
Rather than focusing on every individual number.
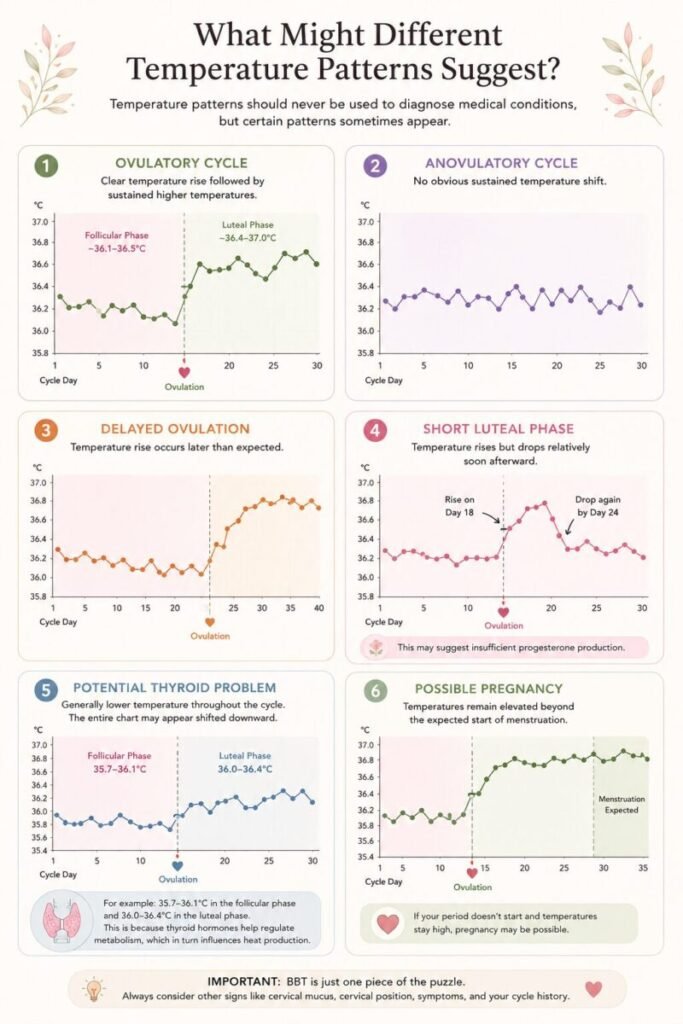
What Might Different Temperature Patterns Suggest?
Temperature patterns should never be used to diagnose medical conditions, but certain patterns sometimes appear.
Ovulatory Cycle
Clear temperature rise followed by sustained higher temperatures.
For example: ~36.1–36.5°C in the follicular phase and ~36.4–37.0°C in the luteal phase.
Anovulatory Cycle
No obvious sustained temperature shift.
Delayed Ovulation
Temperature rise occurs later than expected.
Short Luteal Phase
Temperature rises but drops relatively soon afterward.
For example:
- Rise on Day 18
- Drop again by Day 24
This may suggest insufficient progesterone production.
Potential Thyroid Problem
Generally lower temperature throughout the cycle.
The entire chart may appear shifted downward.
For example:
35.7–36.1°C in the follicular phase and 36.0–36.4°C in the luteal phase
This is because thyroid hormones help regulate metabolism, which in turn influences heat production.
Possible Pregnancy
Temperatures remain elevated beyond the expected start of menstruation.
Remember that temperature charts alone cannot confirm pregnancy or diagnose health conditions.
Temperature Tracking Is About Awareness, Not Perfection
Perhaps the most important thing to remember is that cycle tracking is not a test you pass or fail.
Your chart does not need to look perfect.
The goal is not to create a beautiful graph.
The goal is to become more familiar with your body’s natural rhythms.
Over time, temperature observations can help you recognize patterns, identify cycle changes, and develop a deeper understanding of your reproductive health.
Looking Beyond Fertility
Many women begin tracking temperature because they are curious about ovulation.
Yet they often discover something even more valuable.
When temperature tracking is combined with observations about:
-
Cervical mucus
-
Sleep
-
Mood
-
Energy
-
Exercise
-
Nutrition
-
Symptoms
it becomes easier to recognize patterns and understand how lifestyle factors influence the menstrual cycle.
Track Your Cycle in One Place
My Cycle & Symptom Tracking Journal provides dedicated space to record:
-
Basal body temperature
-
Cervical mucus
-
Menstrual flow
-
Mood
-
Sleep
-
Appetite
-
Exercise
-
Symptoms
-
Lifestyle factors
Many women find that patterns become much easier to recognize when several cycle signs are viewed together over multiple months in a symple table.
Key Takeaways
✓ Basal body temperature is your body’s resting temperature.
✓ Progesterone causes temperature to rise after ovulation.
✓ A sustained temperature increase often indicates ovulation has occurred.
✓ Temperature tracking confirms ovulation better than it predicts it.
✓ Sleep, stress, alcohol, illness, travel, and medications can influence readings.
✓ Perfect charts are not necessary to gain valuable insights.
✓ Tracking multiple cycle signs together provides the clearest picture of your cycle.
Important Note
This article is intended for educational purposes only and should not be used to diagnose, treat, or prevent any medical condition. If you have concerns about your menstrual cycle, fertility, or reproductive health, consult a qualified healthcare professional.